quantify the concentration – scientific image processing

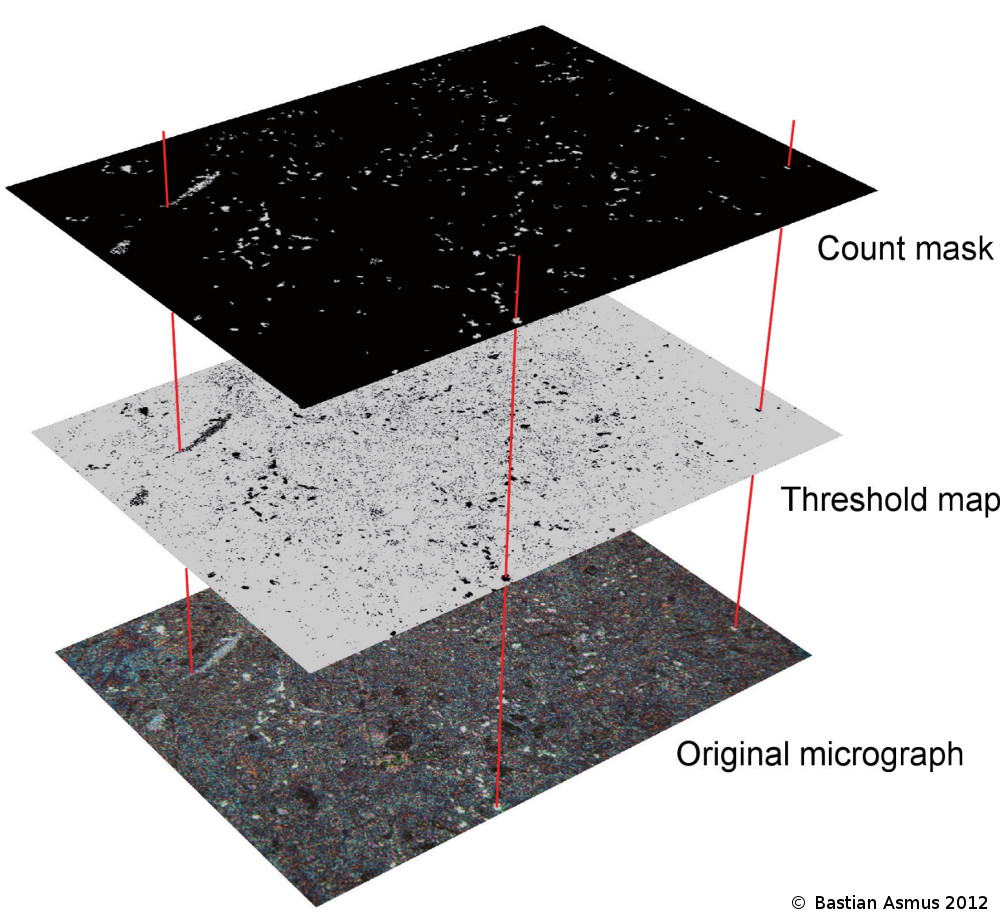
Fig 1: The use of scientific image processing software allows to quantify the area proportion of each phase in optical micrographs. This is a two step process. The original micrograph is converted to a “threshold map” by modifying the colour channels of the source. The resulting black and white image is analysed for their respective area proportions. The count mask is then produced after quantification and may be used to verify which inclusions have been counted.
I used this method during my PhD thesis to approximate the chemical composition based on a micrograph .
A traditional method for the quantification of an alloying element in another is the estimation of the carbon content of a steel sample. The area of carbon inclusions is estimated by comparison with known standards, or better by measuring them. Area proportions are believed to represent volume proportions and need to be multiplied with the density ρ to calculate wt% proportions.
Here optical microscopy was augmented by the use of the scientific digital image processing software package ImageJ that was originally developed for the medical and life sciences, but proved to have sufficient methodological overlap with metallurgical requirements . Next to standard functions such as hue, channel or contrast manipulation, edge detection or sharpening, it can calculate area and pixel value statistics of user-defined selections. It allows the user to apply a scale to an image and can measure distances and angles as well. It is also used to cross check results of various bulk chemical analytical methods and to evaluate these for plausibility, such as for example the WDS-mapping.
The measuring algorithm is based on the presence of black and white pixels. To enable the software to calculate the areas the source image is modified by setting an individual threshold for each colour channel and thereby produce a “threshold map” of the image (fig 1). This threshold map is analysed for the area proportions of each phase. In the analysis setting further control mechanisms are in place to filter noise. As an additional control element a count mask is calculated based on the counted areas. An overlay of the micrograph with the count mask quickly reveals if counted areas coincide with the real areas.

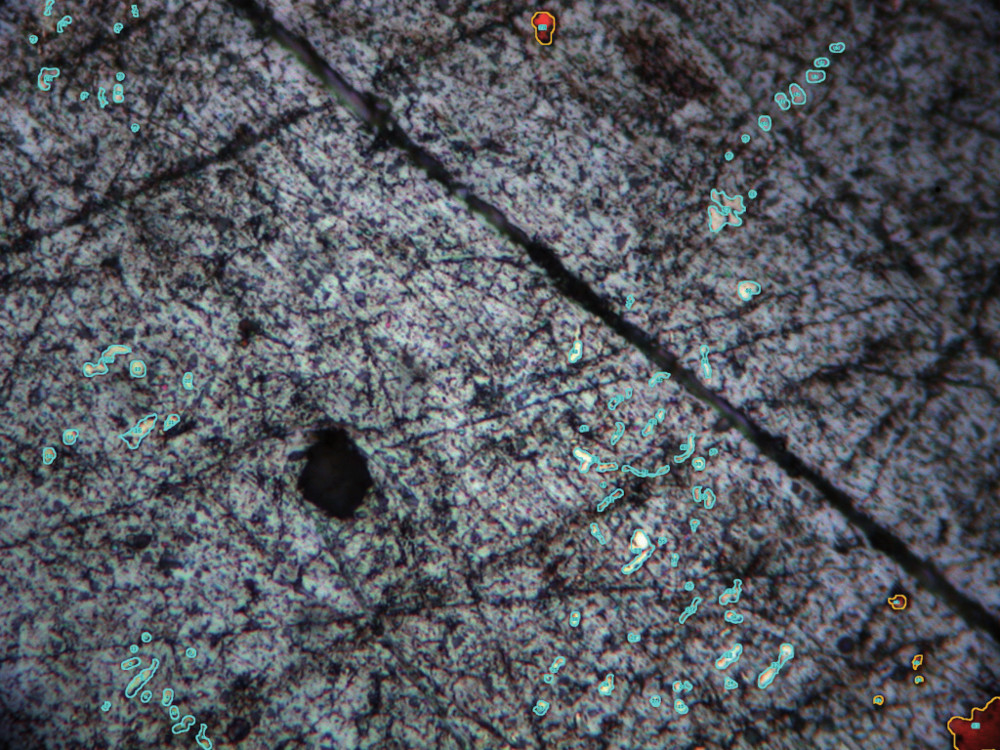
Fig 2: Lead sample, PPL, width 100 µm, total area 0.75 mm2. Lead with white inclusions n=77 and copper inclusions n=6 (orange). Areas delineated in cyan are silver bearing. The open source ImageJ scientific software package is used to calculate the silver and copper area proportions.
The example presented here is a argentiferous lead sample from a medieval copper/lead/silver smelting site near Goslar in Germany (fig 2). Optical microscopy identified three phases: lead, copper and a bright white phase, which appears not as extremely bright as it would be expected from silver. It is not entirely clear as to whether the white phase is pure silver or whether it is a silver antimony alloy or an intermetallic phase, because they are too small for micro-analytical analysis, such as EPMA-WDS. It is most likely, however, that the inclusions are α-silver with elevated antimony concentrations.
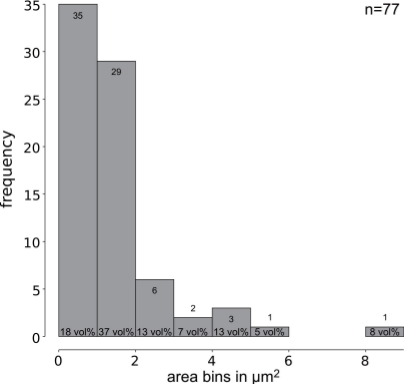
From figure 2 it becomes clear how small the inclusions are, and figure 3 represents the area measrements as histogram. Of the seventy-seven identified inclusions sixty-four are smaller than 2 µm2. Only two inclusions are larger than 5 µm2. This puts constraints on the informational value of electron-microscopical analyses and underscores the need to treat micro-analytical results critically.

Figure 3: Histogram of seventy-seven silver-bearing inclusions in this lead sample. Sixty-four (83 %) of seventy-seven inclusions have an area smaller that 2 µm2 and make up more than 50 vol% of the silver bearing inclusions. Only two samples have areas large enough for SEM-EDS or EPMA-WDS spot analysis.
Calculating the concentration
The silver bearing inclusions occupy an area of 113 µm2, the copper inclusions an area of 27 µm2, the rest of the area is lead with 7360 µm2. It is assumed that area% represent vol%. The calculation of wt% proportions is then straight forward (table 1):

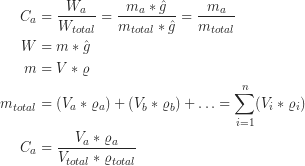
Where W is the weight, m is the mass, and ![]() is the gravitational acceleration, V is the volume, ρ the density, n the number of phases and C the concentration in wt%. The first equation shows that concentrations measured in wt% and in mass% are identical. Equation 5 is the result of putting equation 2 and 3 in equation 1 and shows the relation between volume and wt% proportions.
is the gravitational acceleration, V is the volume, ρ the density, n the number of phases and C the concentration in wt%. The first equation shows that concentrations measured in wt% and in mass% are identical. Equation 5 is the result of putting equation 2 and 3 in equation 1 and shows the relation between volume and wt% proportions.

Table 1: Calculation of weight proportions based upon the area fraction of inclusions.
For pure silver inclusions and area, respectively volume proportion of 1.51 vol% equal 1.40 wt% silver, 0.36 vol% copper equal 0.28 wt% copper and 98.13 vol% lead equal 98.32 wt% lead.
The percentages change if the inclusions turn out to be the ε-phase of the Pb-Sb-Ag system . In that case the inclusions need to be re-calculated with the lower density value of dyscrasite ρ= 9.69 ![]() . The silver concentration in dyscrasite Ag3Sb is 73 wt%. The lower density of dyscrasite results in a lower concentration of dyscrasite in lead: 1.29 wt%. The respective element concentrations in the lead sample are thus 73 % of 1.29 wt% which equals 0.94 wt% Ag and 0.34 wt% Sb.
. The silver concentration in dyscrasite Ag3Sb is 73 wt%. The lower density of dyscrasite results in a lower concentration of dyscrasite in lead: 1.29 wt%. The respective element concentrations in the lead sample are thus 73 % of 1.29 wt% which equals 0.94 wt% Ag and 0.34 wt% Sb.
Assuming that this micrograph is representative of the whole sample it may be stated that the mean bulk silver content of this sample lies between 0.94 wt% and 1.40 wt%, depending on the amount of antimony bonded with silver. Regardless of the antimony contents of this sample, the order of scale of the silver contents is enormous and puts this argentiferous lead sample apparently into a silver production context.
I do know that a blog is possibly not the right format for this kind of post; still, I do hope it might prove useful to those of us who do work a lot with an optical microscope. It also shows how much we can do we with comparatively little effort. Note also that this post is only showing a possible way; refinement of the method will improve data quality. – As always, if you like what you are reading here or have anything to add, you are welcome to leave a comment.
References
Useful weblinks
http://www.unige.ch/medecine/bioimaging/tricks/imagejtutorials/Quantification.pdf


