Dec
17
2014
Bastian Asmus

 ..for any microscope you might happen to work with. During your microscopy sessions, did you ever wish for less of the dull work, such as noting meta data, contrast method, sample id, photo no or image width? Well – I did.
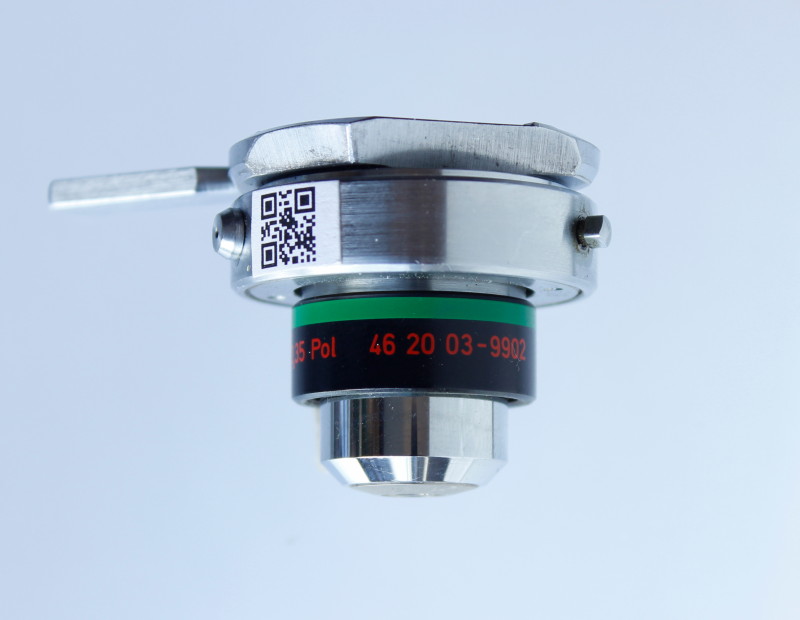
I did wish for a long time to have a way that my microscope and my camera would speak to each other whenever I change objectives. I am working with Zeiss Universal microscope, mostly with reflected polarising light, i.e. there is no objective revolver. I have to change the objectives individually, which of course, all has to do with the ability to centre the objective for certain steps in polarising microscopy.
To make a long story short: the old days where I have to sit there with a notepad and have to write down all these dull informations are over! From now on my camera, or rather my computer registers any change of my microscope objective and adds this information to my micrographs automatically.
Continue reading
no comments | tags: archaeology, archaeometallurgy, How to, linux, photograhpy | posted in Image Meta information, Lab work, Micrograph, Photography, remote capture, tethered shooting
Oct
29
2014
Bastian Asmus

Wouldn’t it be great if you could add meta data to your image files while doing the actual photographing instead of having to do this afterwards in post processing? In this two part article I present how using QR codes and tethered shooting, can achieve this goal when documenting objects. It saves a lot of time, for example, during archaeological find processing and documentation. The first part deals with the manual creation of QR codes, the second part with a script-based solution, that automates the process of adding meta data to image files. Continue reading
1 comment | tags: archaeology, archaeometallurgy, How to, linux, photograhpy
Jan
29
2014
Bastian Asmus

Fig 1: The use of scientific image processing software allows to quantify the area proportion of each phase in optical micrographs. This is a two step process. The original micrograph is converted to a “threshold map” by modifying the colour channels of the source. The resulting black and white image is analysed for their respective area proportions. The count mask is then produced after quantification and may be used to verify which inclusions have been counted.
 I used this method during my PhD thesis to approximate the chemical composition based on a micrograph .
A traditional method for the quantification of an alloying element in another is the estimation of the carbon content of a steel sample. The area of carbon inclusions is estimated by comparison with known standards, or better by measuring them. Area proportions are believed to represent volume proportions and need to be multiplied with the density ρ to calculate wt% proportions. Continue reading
no comments | tags: How to, photograhpy | posted in Analysis, Archaeometallurgy, General, Micrograph, Microscopy, reflected light microscopy, Science