Mar
6
2014
Bastian Asmus

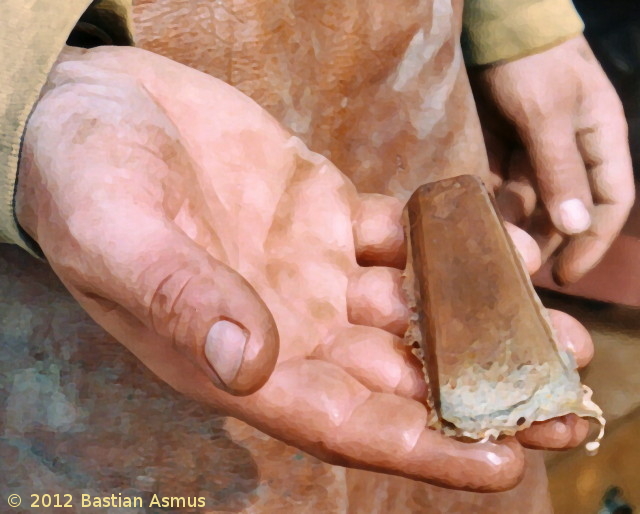
This is a hands-on experiential archaeology course in one of the most important Celtic hill-top fortifications in central Europe: The Heuneburg in south western Germany. On April 26/27 we are holding an intensive course on the archaeometallurgy of bronze with loads of information to go alongside the practical experience of casting bronze the ancient way.
It has been my main objectives to foster the first hand experience of metallurgical processes alongside the scientific study of past archaeometallurgical activities. Together with the Heuneburg Open Air Museum we are now busy developing the Heuneburg Academy, where hands-on experience is thought of as an equally important aspect of archaeometallurgy, as is for example scientific archaeology or archaeology. Only through an transdisciplinary approach will we able to better understand our forebears.
Continue reading
1 comment | tags: casting, course, How to, practical archaeometallurgy | posted in Archaeometallurgy, Metal casting, practical metallurgy
Feb
21
2014
Bastian Asmus

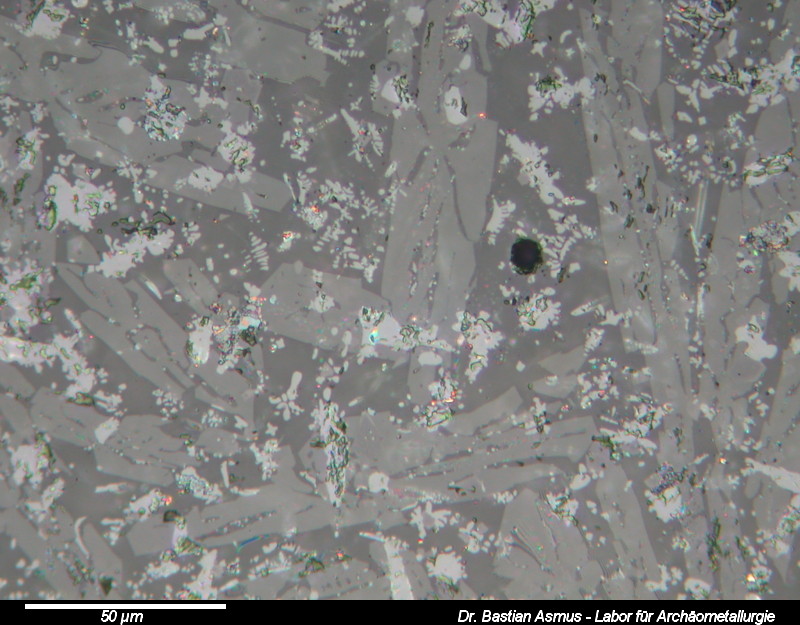
Image width 200 µm, PPL. Medieval copper smelting slag.
The first thing to do is to establish the number of different phases present in the sample. In this case there are five different phases.
If you managed to follow so far, you have now reached part seven part of the slag microscopy course. After sample prep, with find documentation, cutting, mounting, grinding, lapping and polishing we are now going to have a look at the tool to be used for the next sessions: the polarising reflected light microscope, also referred to as an ore microscope. Continue reading
no comments | tags: How to, microscopy, slag | posted in Analysis, Archaeometallurgy, Microscopy, reflected light microscopy, Science, slag
Jan
29
2014
Bastian Asmus

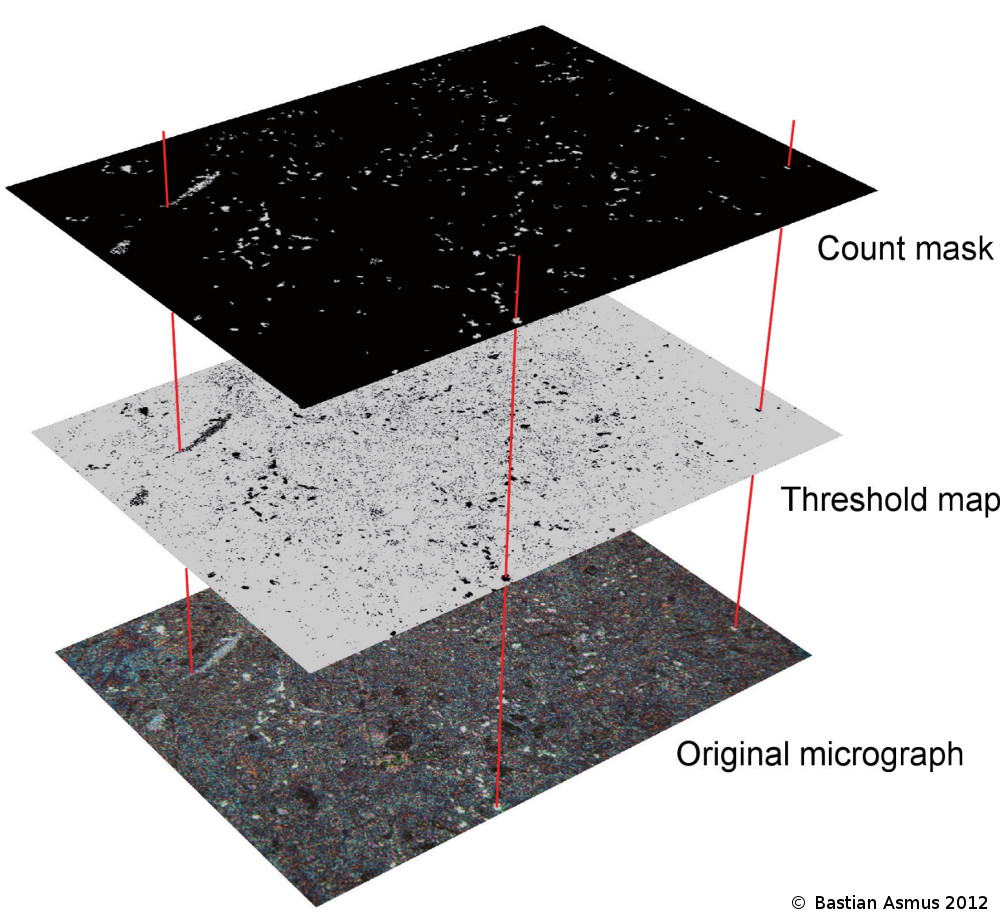
Fig 1: The use of scientific image processing software allows to quantify the area proportion of each phase in optical micrographs. This is a two step process. The original micrograph is converted to a “threshold map” by modifying the colour channels of the source. The resulting black and white image is analysed for their respective area proportions. The count mask is then produced after quantification and may be used to verify which inclusions have been counted.
 I used this method during my PhD thesis to approximate the chemical composition based on a micrograph .
A traditional method for the quantification of an alloying element in another is the estimation of the carbon content of a steel sample. The area of carbon inclusions is estimated by comparison with known standards, or better by measuring them. Area proportions are believed to represent volume proportions and need to be multiplied with the density ρ to calculate wt% proportions. Continue reading
no comments | tags: How to, photograhpy | posted in Analysis, Archaeometallurgy, General, Micrograph, Microscopy, reflected light microscopy, Science


